> ## Documentation Index
> Fetch the complete documentation index at: https://docs.usechamber.io/llms.txt
> Use this file to discover all available pages before exploring further.
# Dashboard
> Real-time GPU utilization, spend efficiency, and AI-powered insights
The Chamber dashboard is your command center for GPU infrastructure. It has two views: the **Executive GPU Usage Dashboard** for real-time operational metrics, and the **GPU Spend & Efficiency Dashboard** for cost analysis and optimization. Switch between them using the tabs at the top of the page.
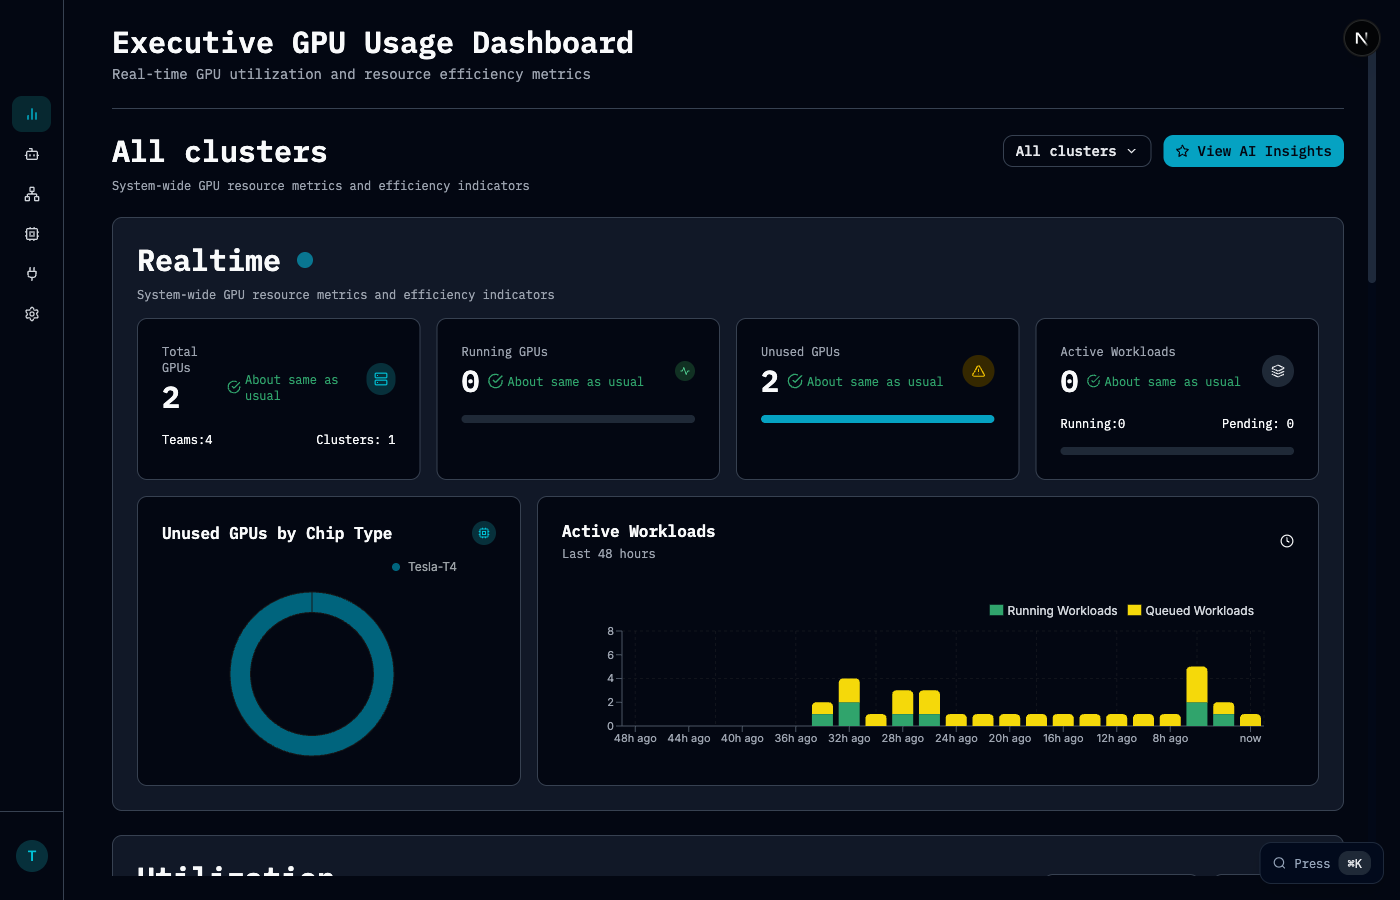 ## Executive GPU Usage Dashboard
Get a live pulse on your GPU fleet.
### Key Metrics
| Metric | Description |
| -------------------- | ----------------------------------- |
| **Total GPUs** | Total GPU count across all clusters |
| **Running GPUs** | GPUs currently executing workloads |
| **Unused GPUs** | GPUs not currently in use |
| **Active Workloads** | Running and pending workloads |
### Features
* **Cluster filtering** — View metrics for specific clusters or all clusters at once
* **Unused GPUs by Chip Type** — Breakdown of idle GPUs by GPU model
* **Active Workloads chart** — Running vs. queued workloads over the last 48 hours
* **Utilization trends** — Track GPU usage patterns over time
## GPU Spend & Efficiency Dashboard
See the financial picture behind your GPU usage — where the money goes, what's being wasted, and where to optimize.
### Headline Metrics
Five KPIs give you the high-level story:
| Metric | Description |
| ------------------------- | ------------------------------------------------------------- |
| **Total GPU Spend** | Organization-wide GPU cost from workload runtime |
| **Effective Utilization** | Percentage of provisioned capacity actively used by workloads |
| **Recoverable Waste** | Cost from failed, preempted, or short-runtime workloads |
| **Idle Cost** | Provisioned GPU capacity that went unused |
| **Forecast Month-End** | Projected total spend by end of month with trend indicator |
### Spend Breakdown
Three side-by-side cards show your top cost drivers:
* **By GPU Type** — Which hardware is costing the most
* **By Cluster** — Which capacity pools have the highest spend
* **By Team** — Team rankings with utilization efficiency bars
Each card shows cost, percentage of total, utilization rate, and waste percentage for the top 3 contributors.
### Spend by Utilization Band
A horizontal bar chart groups your spend into utilization ranges so you can immediately see where efficiency breaks down:
| Band | Utilization | What It Means |
| ----------------------- | ----------- | ---------------------------------------- |
| Severe underutilization | 0-20% | GPUs mostly idle during workload runtime |
| Poor utilization | 20-40% | Significant optimization opportunity |
| Acceptable | 40-60% | Room for improvement |
| Good | 60-80% | Healthy usage |
| Excellent | 80-100% | Near-optimal GPU efficiency |
If more than 40% of your spend falls below 40% utilization, Chamber flags this as a recoverable waste opportunity with specific recommendations.
### AI Insights
Chamber generates AI-powered analysis of your spend patterns, surfacing:
* **Critical waste alerts** — Highlights the percentage of spend with low utilization and what to do about it
* **Workload distribution analysis** — Shows how workloads cluster across utilization bands
* **Recommended actions** — Specific next steps like GPU type prioritization, team-specific rightsizing, and auto-scaling policy suggestions
### Spend Trends
Three time-series charts track how costs evolve:
* **Daily Spend** — Total cost per day
* **Spend by GPU Type** — Stacked area chart breaking out hardware cost distribution
* **Idle vs. Used Cost** — Stacked area showing provisioned capacity vs. actual workload usage
### Forecasts
See where spend is heading, broken down by:
* **Cluster** — Projected cost per capacity pool
* **GPU Type** — Projected cost per hardware type
* **Team** — Projected cost per team
### Team Leaderboard
A ranked table showing every team's cost efficiency:
| Column | Description |
| ----------------- | ------------------------------------------------------------------- |
| **Spend** | Total GPU cost for the team |
| **% of Total** | Team's share of organization-wide spend |
| **Utilization** | GPU efficiency percentage (color-coded) |
| **Est. Waste** | Estimated spend lost to utilization below the 70% efficiency target |
| **Cost/Workload** | Average GPU cost per completed workload |
Click any team to jump to their detailed project view.
Need to dig deeper with custom filters, CSV exports, or longer forecasts? Head to the [Cost Explorer](/platform/cost-explorer).
## Executive GPU Usage Dashboard
Get a live pulse on your GPU fleet.
### Key Metrics
| Metric | Description |
| -------------------- | ----------------------------------- |
| **Total GPUs** | Total GPU count across all clusters |
| **Running GPUs** | GPUs currently executing workloads |
| **Unused GPUs** | GPUs not currently in use |
| **Active Workloads** | Running and pending workloads |
### Features
* **Cluster filtering** — View metrics for specific clusters or all clusters at once
* **Unused GPUs by Chip Type** — Breakdown of idle GPUs by GPU model
* **Active Workloads chart** — Running vs. queued workloads over the last 48 hours
* **Utilization trends** — Track GPU usage patterns over time
## GPU Spend & Efficiency Dashboard
See the financial picture behind your GPU usage — where the money goes, what's being wasted, and where to optimize.
### Headline Metrics
Five KPIs give you the high-level story:
| Metric | Description |
| ------------------------- | ------------------------------------------------------------- |
| **Total GPU Spend** | Organization-wide GPU cost from workload runtime |
| **Effective Utilization** | Percentage of provisioned capacity actively used by workloads |
| **Recoverable Waste** | Cost from failed, preempted, or short-runtime workloads |
| **Idle Cost** | Provisioned GPU capacity that went unused |
| **Forecast Month-End** | Projected total spend by end of month with trend indicator |
### Spend Breakdown
Three side-by-side cards show your top cost drivers:
* **By GPU Type** — Which hardware is costing the most
* **By Cluster** — Which capacity pools have the highest spend
* **By Team** — Team rankings with utilization efficiency bars
Each card shows cost, percentage of total, utilization rate, and waste percentage for the top 3 contributors.
### Spend by Utilization Band
A horizontal bar chart groups your spend into utilization ranges so you can immediately see where efficiency breaks down:
| Band | Utilization | What It Means |
| ----------------------- | ----------- | ---------------------------------------- |
| Severe underutilization | 0-20% | GPUs mostly idle during workload runtime |
| Poor utilization | 20-40% | Significant optimization opportunity |
| Acceptable | 40-60% | Room for improvement |
| Good | 60-80% | Healthy usage |
| Excellent | 80-100% | Near-optimal GPU efficiency |
If more than 40% of your spend falls below 40% utilization, Chamber flags this as a recoverable waste opportunity with specific recommendations.
### AI Insights
Chamber generates AI-powered analysis of your spend patterns, surfacing:
* **Critical waste alerts** — Highlights the percentage of spend with low utilization and what to do about it
* **Workload distribution analysis** — Shows how workloads cluster across utilization bands
* **Recommended actions** — Specific next steps like GPU type prioritization, team-specific rightsizing, and auto-scaling policy suggestions
### Spend Trends
Three time-series charts track how costs evolve:
* **Daily Spend** — Total cost per day
* **Spend by GPU Type** — Stacked area chart breaking out hardware cost distribution
* **Idle vs. Used Cost** — Stacked area showing provisioned capacity vs. actual workload usage
### Forecasts
See where spend is heading, broken down by:
* **Cluster** — Projected cost per capacity pool
* **GPU Type** — Projected cost per hardware type
* **Team** — Projected cost per team
### Team Leaderboard
A ranked table showing every team's cost efficiency:
| Column | Description |
| ----------------- | ------------------------------------------------------------------- |
| **Spend** | Total GPU cost for the team |
| **% of Total** | Team's share of organization-wide spend |
| **Utilization** | GPU efficiency percentage (color-coded) |
| **Est. Waste** | Estimated spend lost to utilization below the 70% efficiency target |
| **Cost/Workload** | Average GPU cost per completed workload |
Click any team to jump to their detailed project view.
Need to dig deeper with custom filters, CSV exports, or longer forecasts? Head to the [Cost Explorer](/platform/cost-explorer).